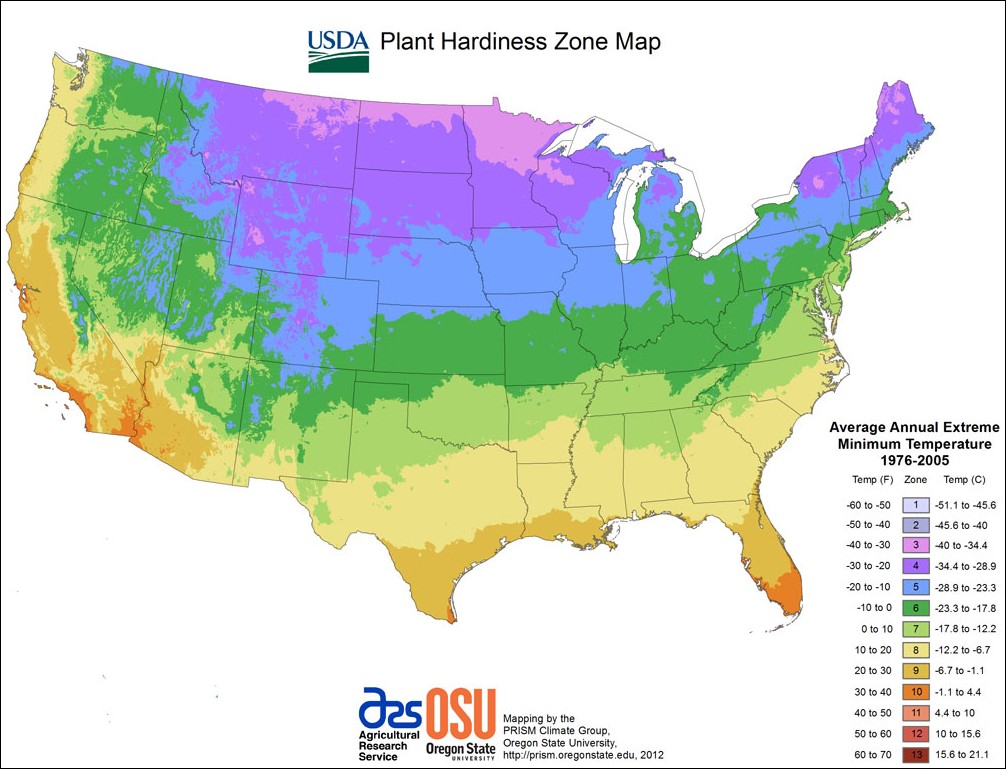
THE LIMITS OF THE AVERAGE ANNUAL MINIMUM TEMPERATURES FOR EACH ZONE
Zone 1
Below -50*F
Zone 2
-50° to -35°
Zone 3
-35° to -20°
Zone 4
-20° to -10°
Zone 5
-10° to -5°
Zone 6
-5° to 5°
Zone 7
5° to 10°
Zone 8
10° to 20°
Zone 9
20° to 30°
Zone 10
30° to 40°
Most gardeners are familiar with the U.S. Department of Agriculture's
Plant Hardiness Zone Map. First published in 1960 and updated in
1990, this map is based on average annual minimum temperatures recorded
throughout North America. By using the map to find the zone in which
they live, gardeners are able to determine what plants will "winter
over" in their garden because they can withstand these average
minimum temperatures.
Although these zones are useful as an indicator of a plant's likelihood
for survival in a given area, many factors, including soil type
and fertility, soil moisture and drainage, humidity, and exposure
to sun and wind determine a plant's growth and success or failure
in its enviroment. Today, nearly all American reference books, nursery
catalogs, and gardening magazines describe plants using USDA hardiness
zones.
 Planting Tips